Individual Events:
You can assess specific heart rate metrics across multiple events for a single athlete on the Individual Events view.
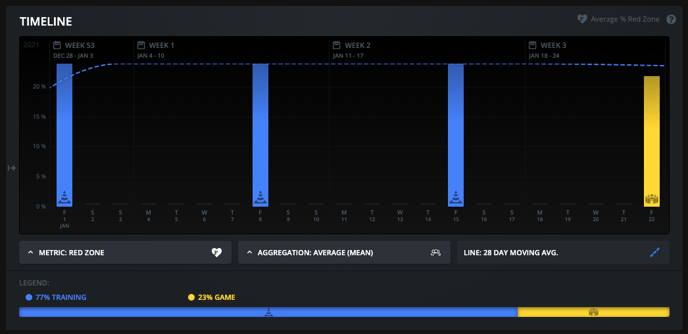
The timeline and graph views on the individual events page allow users to view % of time in Red Zone as your key metric.
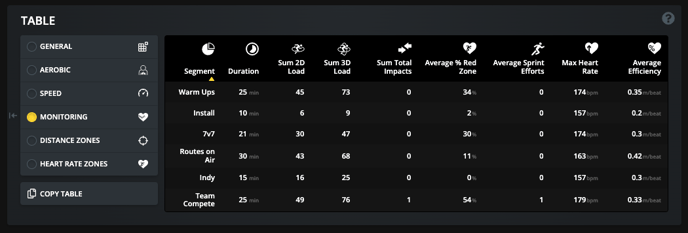
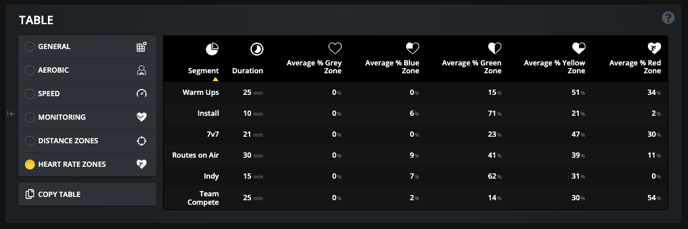
The table on the bottom of the individual events view can also be used to display heart rate data. Two of the metric sets contain heart rate data. (This view will display event by event data and will also adjust based on the filters you have applied).
- Monitoring: 2D Load, 3D Load, % Red Zone, Max Heart Rate, Efficiency Index
- Heart Rate Zones: % Grey Zone, % Blue Zone, % Green Zone, % Yellow Zone, % Red Zone
Individual Performance:
Users can select one of three heart rate metrics on the intervals graph. Heart rate zones, Average/Maximum Heart Rate & Efficiency Index.
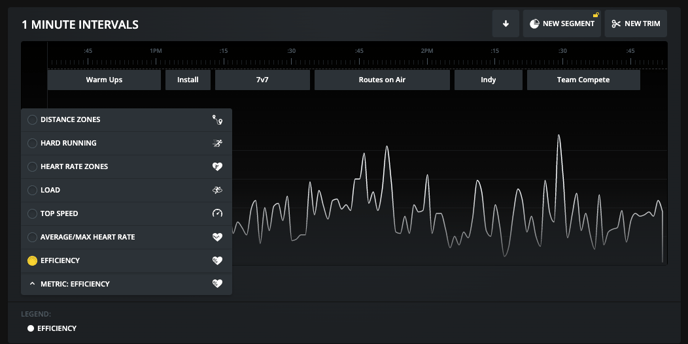
In the image above when using 'Heart Rate Zones" the graph legend will update dependent on your segment selection. This allows coaches to view the % of time spent in each heart rate zone across a full event or within specific drills/segments.
The table on the bottom of the individual performance view can also be used to display heart rate data. Two of the metric sets contain heart rate data. (This will display segment data once you add segments to the event).
- Monitoring: 2D Load, 3D Load, % Red Zone, Max Heart Rate, Efficiency Index
- Heart Rate Zones: % Grey Zone, % Blue Zone, % Green Zone, % Yellow Zone, % Red Zone