Page Heading:
Page heading contains Team Name and other relevant data such as competition and sport.
+Add Event functionality, please click here to view the full team event upload workflow.
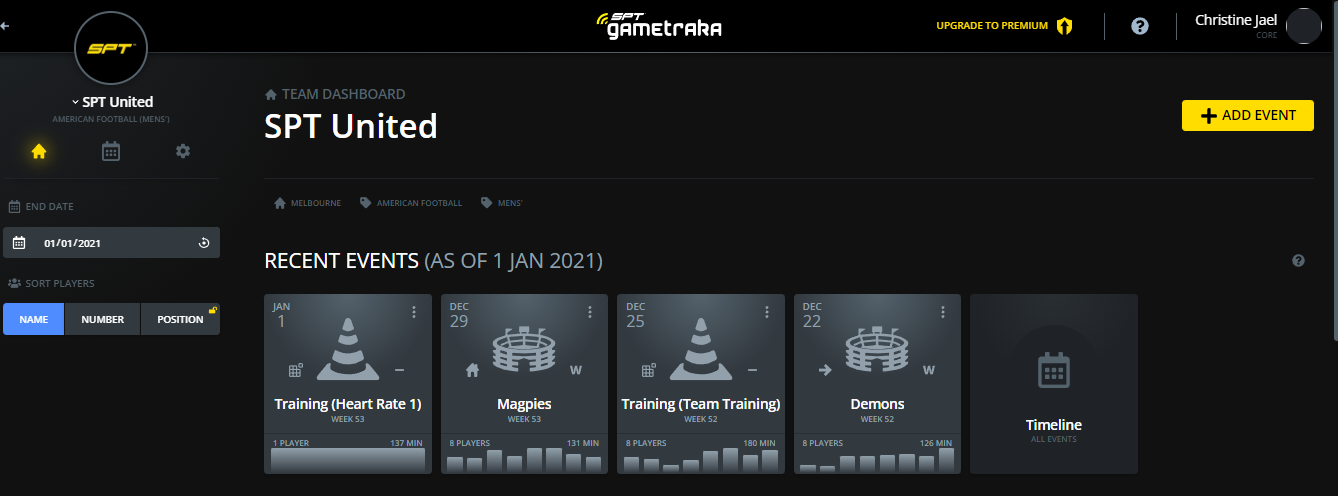
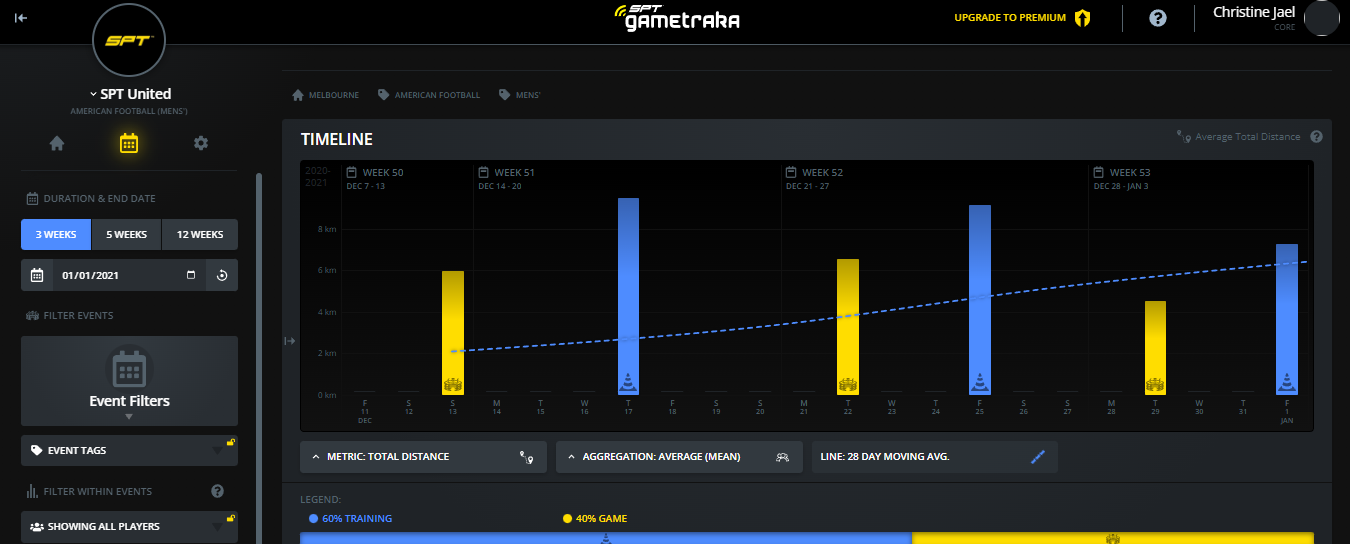
Quick link cards to most recent events (2 weeks) and a click link icon to Team Timeline view.
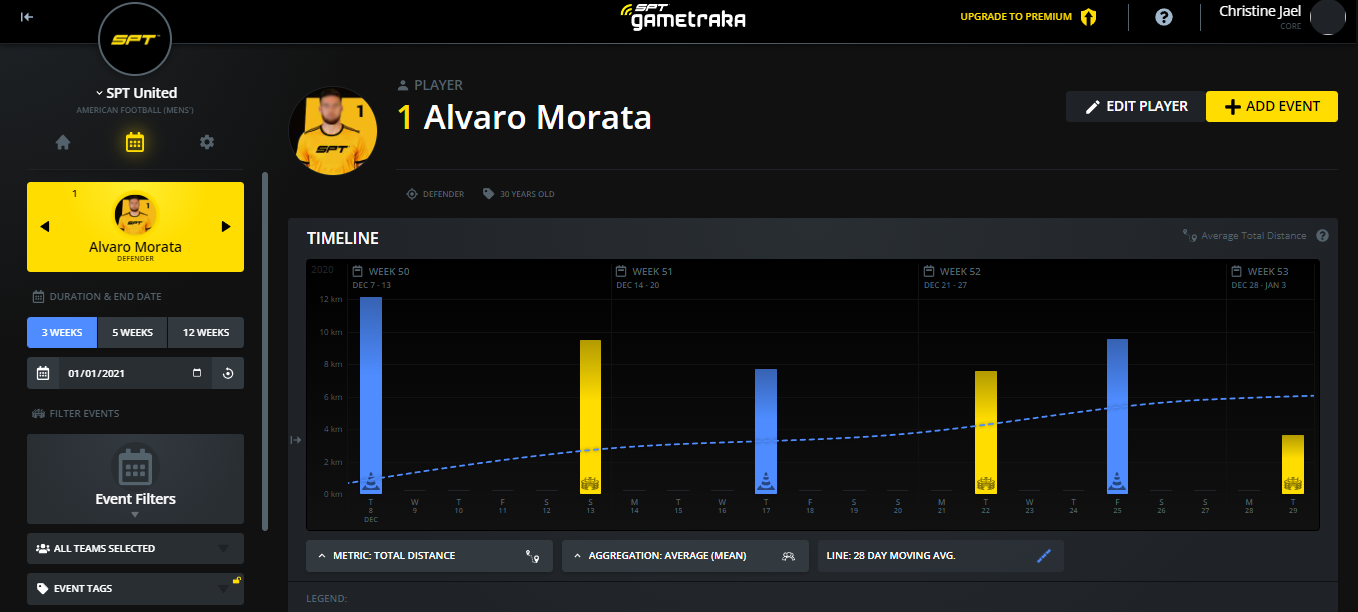
Athlete cards can be used to get a quick insight in to current athlete workflow status.
Workload Status: You can get a snapshot of how an athlete's current weekly load (2D Load) compares to the average of their last 4 weeks. Depending on the volume of work athletes have undertaken for the current week, will dictate whether they may be falling under their required workload (red), completing an appropriate amount of work (yellow/green) or completing too much work (red). Click here to learn more about the Acute:Chronic Workload Ratio.
Weekly Load: Both total distance and sprint distance for the current week are displayed, along with a trend arrow demonstrating if an athlete has completed more or less than the previous week.
Last 8 Weeks: The total distance covered for each of the last 8 weeks is displayed as a bar chart on the bottom of the player card.
Clicking on an athlete card will also take you directly to an Athlete Timeline.
Team Dashboards contain a left hand filter panel
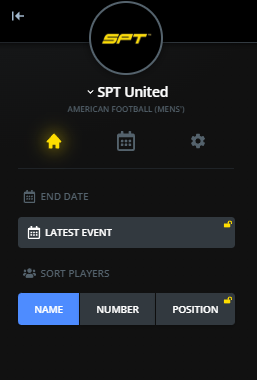
The End Date filter can be used to set your dashboard at any date in the past you wish.
The filter panel also contains athlete sorting functions relating to Name, Number and Position.