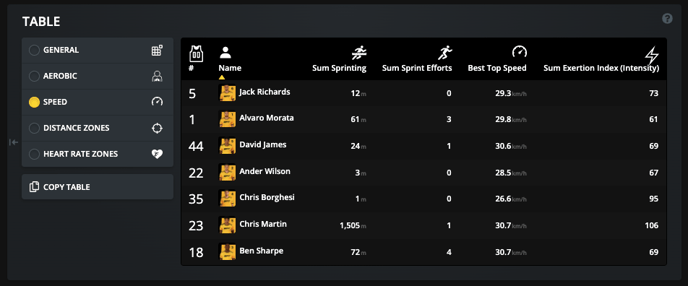
Users have the option to select from 4 sets of metrics on both the Team Timeline and Team Event views.
Each set of metrics relates to specific elements of fitness and will hold relevance to a range of athlete playing positions across several sports.
As a coach you should consider your sport and athletes playing position when selecting a set of metrics to complete your analysis.
For example, you might select the speed metrics when assessing a winger in Rugby or a forward in Soccer.
Users also have the option to 'copy' the metrics in the table for use in external reports such as Excel etc.
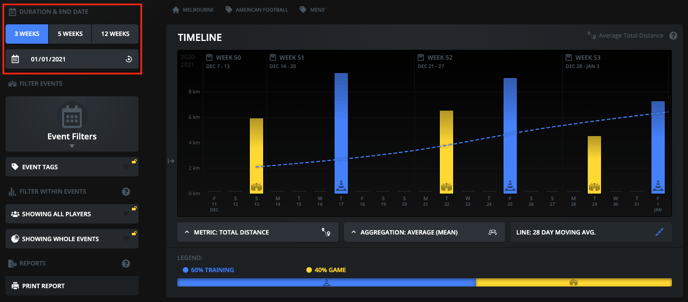
Team Timeline Controls (Multiple Events):
The metrics displayed on the 'Timeline' pages are an average of all the athletes that participated in the selected events. You can modify the events that you view on the Timeline by using the Sidebar Controls on the left hand side of the page.
Team Event Controls (Single Event):
The metrics displayed on a single event view is the total or maximum (eg top speed) achieved by each athlete that participated in the event.